Composite Service Strength
Fatigue test according to RHV 99
Measuring the fatigue behaviour of fibre-reinforced plastics is the key to predict service lifetime of parts and structures, whereat the anisotropic materials show a very different behaviour from isotropic materials like metals. For composites, fatigue is essentially created by initiation, growth and propagation of a multitude of cracks. The evolution of damage is influenced not only by the materials of matrix and fibres but also by the composition of the laminate. Although it is highly specific to the individual material, it usually follows the stages below:
- Initiation of lateral cracks in laminate layers out of loading direction
- Initiation of longitudinal cracks alongside load-bearing fibres
- Delaminationen alongside rim of specimen
- Internal delamination due to lateral and longitudinal cracks
- Fracture of load-bearing fibres due to buckling
- Delamination due to shear stress
- Complete failure of the part or specimen
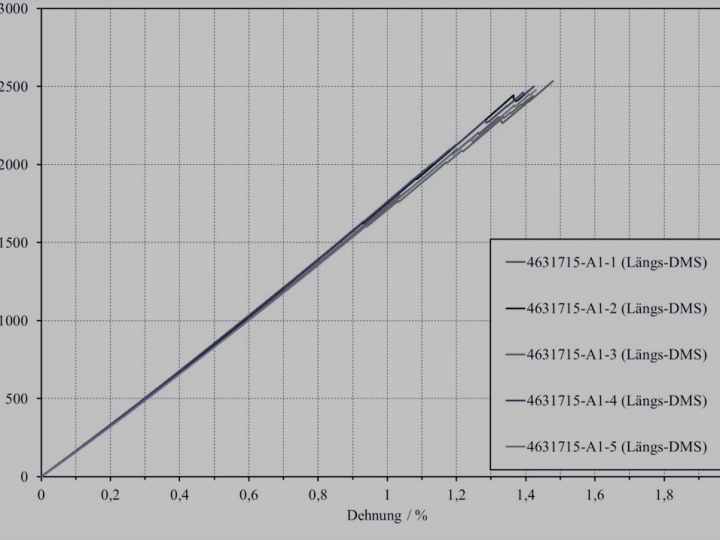
At Grasse Zur Composite Testing, fibre-reinforced plastics are tested under tensile-compressive alternating load (load ratio R = -1), tensile-tensile load (load ratio R = 0.1) or compressive-compressive load (load ratio R = 10). The load type is defined by the fibre orientation. A fibre orientation in 0°, 90° or 0°/90° direction leads to tensile or compressive loads, a fibre orientation in +/-45° direction leads to shear loads. To avoid premature fibre buckling, a buckling support (e.g. GZ BS-32) will be used.
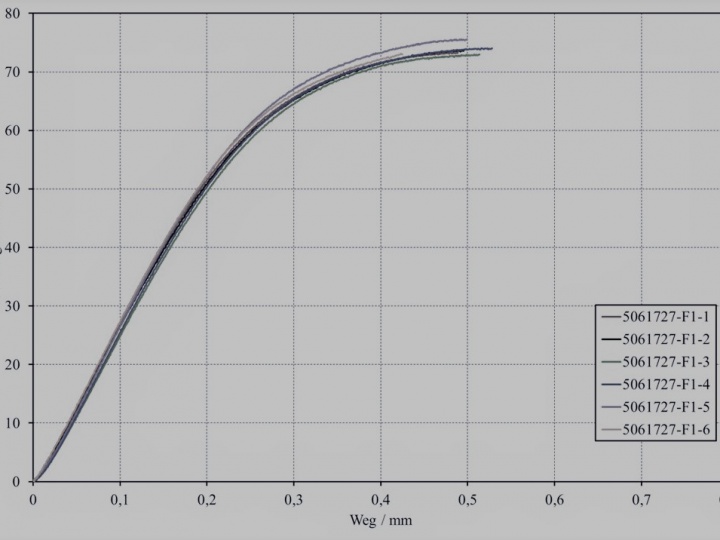
The bending properties (interlaminar shear) of fibre-reinforced plastics and sandwich materials are characterised with a 3-point / 4-point alternating flexure fixture (e.g. GZ B-50) suitable for cyclic testing. By varying the fibre orientation, additional information on the tensile and compressive properties of the materials can be obtained. The fatigue behaviour is investigated on different materials such as long or continuous fibre-reinforced plastics with thermoset or thermoplastic matrix. Qualitative statements, S/N curves, Basquin line equations or Haigh diagrams are generated for evaluation. When interpreting the data, it is always possible to fall back on many years of know-how.